【转】Java Hotspot G1 GC 的一些关键技术
原文地址:https://tech.meituan.com/2016/09/23/g1.html
前言
G1 GC,全称 Garbage-First Garbage Collector,通过 -XX:+UseG1GC 参数来启用,作为体验版随着 JDK 6u14 版本面世,在 JDK 7u4 版本发行时被正式推出,相信熟悉 JVM 的同学们都不会对它感到陌生。在 JDK 9 中,G1 被提议设置为默认垃圾收集器(JEP 248)。在官网中,是这样描述 G1 的:
The Garbage-First (G1) collector is a server-style garbage collector, targeted for multi-processor machines with large memories. It meets garbage collection (GC) pause time goals with a high probability, while achieving high throughput. The G1 garbage collector is fully supported in Oracle JDK 7 update 4 and later releases. The G1 collector is designed for applications that:
- Can operate concurrently with applications threads like the CMS collector.
- Compact free space without lengthy GC induced pause times.
- Need more predictable GC pause durations.
- Do not want to sacrifice a lot of throughput performance.
- Do not require a much larger Java heap.
从官网的描述中,我们知道 G1 是一种服务器端的垃圾收集器,应用在多处理器和大容量内存环境中,在实现高吞吐量的同时,尽可能的满足垃圾收集暂停时间的要求。它是专门针对以下应用场景设计的:
- 像 CMS 收集器一样,能与应用程序线程并发执行。
- 整理空闲空间更快。
- 需要 GC 停顿时间更好预测。
- 不希望牺牲大量的吞吐性能。
- 不需要更大的 Java Heap。
G1 收集器的设计目标是取代 CMS 收集器,它同 CMS 相比,在以下方面表现的更出色:
- G1 是一个有整理内存过程的垃圾收集器,不会产生很多内存碎片。
- G1 的 Stop The World(STW) 更可控,G1 在停顿时间上添加了预测机制,用户可以指定期望停顿时间。
有了以上的特性,难怪有人说它是一款驾驭一切的垃圾收集器(G1: One Garbage Collector To Rule Them All)。本文带大家来了解一下 G1 GC 的一些关键技术,为能正确的使用它,做好理论基础的铺垫。
G1 中几个重要概念
在 G1 的实现过程中,引入了一些新的概念,对于实现高吞吐、没有内存碎片、收集时间可控等功能起到了关键作用。下面我们就一起看一下 G1 中的这几个重要概念。
Region
传统的 GC 收集器将连续的内存空间划分为新生代、老年代和永久代(JDK 8 去除了永久代,引入了元空间 Metaspace),这种划分的特点是各代的存储地址(逻辑地址,下同)是连续的。如下图所示: 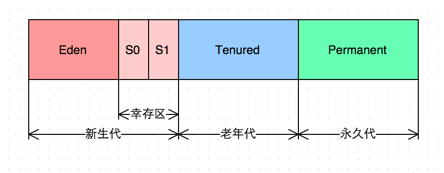
传统 GC 内存布局
而 G1 的各代存储地址是不连续的,每一代都使用了 n 个不连续的大小相同的 Region,每个 Region 占有一块连续的虚拟内存地址。如下图所示: 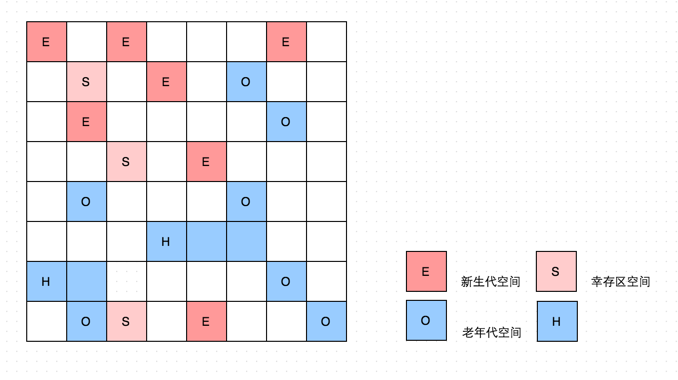
g1 GC 内存布局
在上图中,我们注意到还有一些 Region 标明了 H,它代表 Humongous,这表示这些 Region 存储的是巨大对象(humongous object,H-obj),即大小大于等于 region 一半的对象。H-obj 有如下几个特征:
- H-obj 直接分配到了 old gen,防止了反复拷贝移动。
- H-obj 在 global concurrent marking 阶段的 cleanup 和 full GC 阶段回收。
- 在分配 H-obj 之前先检查是否超过 initiating heap occupancy percent 和 the marking threshold, 如果超过的话,就启动 global concurrent marking,为的是提早回收,防止 evacuation failures 和 full GC。
为了减少连续 H-objs 分配对 GC 的影响,需要把大对象变为普通的对象,建议增大 Region size。
一个 Region 的大小可以通过参数 -XX:G1HeapRegionSize 设定,取值范围从 1M 到 32M,且是 2 的指数。如果不设定,那么 G1 会根据 Heap 大小自动决定。相关的设置代码如下:
1 | // share/vm/gc_implementation/g1/heapRegion.cpp |
SATB
全称是 Snapshot-At-The-Beginning,由字面理解,是 GC 开始时活着的对象的一个快照。它是通过 Root Tracing 得到的,作用是维持并发 GC 的正确性。 那么它是怎么维持并发 GC 的正确性的呢?根据三色标记算法,我们知道对象存在三种状态:
- 白:对象没有被标记到,标记阶段结束后,会被当做垃圾回收掉。
- 灰:对象被标记了,但是它的 field 还没有被标记或标记完。
- 黑:对象被标记了,且它的所有 field 也被标记完了。
由于并发阶段的存在,Mutator 和 Garbage Collector 线程同时对对象进行修改,就会出现白对象漏标的情况,这种情况发生的前提是:
- Mutator 赋予一个黑对象该白对象的引用。
- Mutator 删除了所有从灰对象到该白对象的直接或者间接引用。
对于第一个条件,在并发标记阶段,如果该白对象是 new 出来的,并没有被灰对象持有,那么它会不会被漏标呢?Region 中有两个 top-at-mark-start(TAMS)指针,分别为 prevTAMS 和 nextTAMS。在 TAMS 以上的对象是新分配的,这是一种隐式的标记。对于在 GC 时已经存在的白对象,如果它是活着的,它必然会被另一个对象引用,即条件二中的灰对象。如果灰对象到白对象的直接引用或者间接引用被替换了,或者删除了,白对象就会被漏标,从而导致被回收掉,这是非常严重的错误,所以 SATB 破坏了第二个条件。也就是说,一个对象的引用被替换时,可以通过 write barrier 将旧引用记录下来。
1 | // share/vm/gc_implementation/g1/g1SATBCardTableModRefBS.hpp |
SATB 也是有副作用的,如果被替换的白对象就是要被收集的垃圾,这次的标记会让它躲过 GC,这就是 float garbage。因为 SATB 的做法精度比较低,所以造成的 float garbage 也会比较多。
RSet
全称是 Remembered Set,是辅助 GC 过程的一种结构,典型的空间换时间工具,和 Card Table 有些类似。还有一种数据结构也是辅助 GC 的:Collection Set(CSet),它记录了 GC 要收集的 Region 集合,集合里的 Region 可以是任意年代的。在 GC 的时候,对于 old->young 和 old->old 的跨代对象引用,只要扫描对应的 CSet 中的 RSet 即可。 逻辑上说每个 Region 都有一个 RSet,RSet 记录了其他 Region 中的对象引用本 Region 中对象的关系,属于 points-into 结构(谁引用了我的对象)。而 Card Table 则是一种 points-out(我引用了谁的对象)的结构,每个 Card 覆盖一定范围的 Heap(一般为 512Bytes)。G1 的 RSet 是在 Card Table 的基础上实现的:每个 Region 会记录下别的 Region 有指向自己的指针,并标记这些指针分别在哪些 Card 的范围内。 这个 RSet 其实是一个 Hash Table,Key 是别的 Region 的起始地址,Value 是一个集合,里面的元素是 Card Table 的 Index。
下图表示了 RSet、Card 和 Region 的关系(出处): 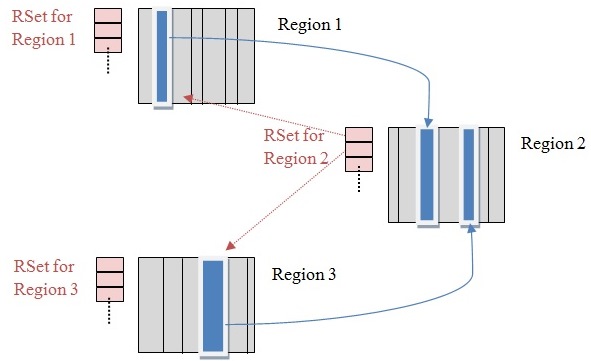
Remembered Sets
上图中有三个 Region,每个 Region 被分成了多个 Card,在不同 Region 中的 Card 会相互引用,Region1 中的 Card 中的对象引用了 Region2 中的 Card 中的对象,蓝色实线表示的就是 points-out 的关系,而在 Region2 的 RSet 中,记录了 Region1 的 Card,即红色虚线表示的关系,这就是 points-into。 而维系 RSet 中的引用关系靠 post-write barrier 和 Concurrent refinement threads 来维护,操作伪代码如下(出处):
1 | void oop_field_store(oop* field, oop new_value) { |
post-write barrier 记录了跨 Region 的引用更新,更新日志缓冲区则记录了那些包含更新引用的 Cards。一旦缓冲区满了,Post-write barrier 就停止服务了,会由 Concurrent refinement threads 处理这些缓冲区日志。 RSet 究竟是怎么辅助 GC 的呢?在做 YGC 的时候,只需要选定 young generation region 的 RSet 作为根集,这些 RSet 记录了 old->young 的跨代引用,避免了扫描整个 old generation。 而 mixed gc 的时候,old generation 中记录了 old->old 的 RSet,young->old 的引用由扫描全部 young generation region 得到,这样也不用扫描全部 old generation region。所以 RSet 的引入大大减少了 GC 的工作量。
Pause Prediction Model
Pause Prediction Model 即停顿预测模型。它在 G1 中的作用是:
G1 uses a pause prediction model to meet a user-defined pause time target and selects the number of regions to collect based on the specified pause time target.
G1 GC 是一个响应时间优先的 GC 算法,它与 CMS 最大的不同是,用户可以设定整个 GC 过程的期望停顿时间,参数 -XX:MaxGCPauseMillis 指定一个 G1 收集过程目标停顿时间,默认值 200ms,不过它不是硬性条件,只是期望值。那么 G1 怎么满足用户的期望呢?就需要这个停顿预测模型了。G1 根据这个模型统计计算出来的历史数据来预测本次收集需要选择的 Region 数量,从而尽量满足用户设定的目标停顿时间。 停顿预测模型是以衰减标准偏差为理论基础实现的:
1 | // share/vm/gc_implementation/g1/g1CollectorPolicy.hpp |
在这个预测计算公式中:davg 表示衰减均值,sigma() 返回一个系数,表示信赖度,dsd 表示衰减标准偏差,confidence_factor 表示可信度相关系数。而方法的参数 TruncateSeq,顾名思义,是一个截断的序列,它只跟踪了序列中的最新的 n 个元素。
在 G1 GC 过程中,每个可测量的步骤花费的时间都会记录到 TruncateSeq(继承了 AbsSeq)中,用来计算衰减均值、衰减变量,衰减标准偏差等:
1 | // src/share/vm/utilities/numberSeq.cpp |
比如要预测一次 GC 过程中,RSet 的更新时间,这个操作主要是将 Dirty Card 加入到 RSet 中,具体原理参考前面的 RSet。每个 Dirty Card 的时间花费通过_cost_per_card_ms_seq 来记录,具体预测代码如下:
1 | // share/vm/gc_implementation/g1/g1CollectorPolicy.hpp |
get_new_prediction 就是我们开头说的方法,现在大家应该基本明白停顿预测模型的实现原理了。
GC 过程
讲完了一些基本概念,下面我们就来看看 G1 的 GC 过程是怎样的。
G1 GC 模式
G1 提供了两种 GC 模式,Young GC 和 Mixed GC,两种都是完全 Stop The World 的。
- Young GC:选定所有年轻代里的 Region。通过控制年轻代的 region 个数,即年轻代内存大小,来控制 young GC 的时间开销。
- Mixed GC:选定所有年轻代里的 Region,外加根据 global concurrent marking 统计得出收集收益高的若干老年代 Region。在用户指定的开销目标范围内尽可能选择收益高的老年代 Region。
由上面的描述可知,Mixed GC 不是 full GC,它只能回收部分老年代的 Region,如果 mixed GC 实在无法跟上程序分配内存的速度,导致老年代填满无法继续进行 Mixed GC,就会使用 serial old GC(full GC)来收集整个 GC heap。所以我们可以知道,G1 是不提供 full GC 的。
上文中,多次提到了 global concurrent marking,它的执行过程类似 CMS,但是不同的是,在 G1 GC 中,它主要是为 Mixed GC 提供标记服务的,并不是一次 GC 过程的一个必须环节。global concurrent marking 的执行过程分为四个步骤:
- 初始标记(initial mark,STW)。它标记了从 GC Root 开始直接可达的对象。
- 并发标记(Concurrent Marking)。这个阶段从 GC Root 开始对 heap 中的对象标记,标记线程与应用程序线程并行执行,并且收集各个 Region 的存活对象信息。
- 最终标记(Remark,STW)。标记那些在并发标记阶段发生变化的对象,将被回收。
- 清除垃圾(Cleanup)。清除空 Region(没有存活对象的),加入到 free list。
第一阶段 initial mark 是共用了 Young GC 的暂停,这是因为他们可以复用 root scan 操作,所以可以说 global concurrent marking 是伴随 Young GC 而发生的。第四阶段 Cleanup 只是回收了没有存活对象的 Region,所以它并不需要 STW。
Young GC 发生的时机大家都知道,那什么时候发生 Mixed GC 呢?其实是由一些参数控制着的,另外也控制着哪些老年代 Region 会被选入 CSet。
- G1HeapWastePercent:在 global concurrent marking 结束之后,我们可以知道 old gen regions 中有多少空间要被回收,在每次 YGC 之后和再次发生 Mixed GC 之前,会检查垃圾占比是否达到此参数,只有达到了,下次才会发生 Mixed GC。
- G1MixedGCLiveThresholdPercent:old generation region 中的存活对象的占比,只有在此参数之下,才会被选入 CSet。
- G1MixedGCCountTarget:一次 global concurrent marking 之后,最多执行 Mixed GC 的次数。
- G1OldCSetRegionThresholdPercent:一次 Mixed GC 中能被选入 CSet 的最多 old generation region 数量。
除了以上的参数,G1 GC 相关的其他主要的参数有:
| 参数 | 含义 |
|---|---|
| -XX:G1HeapRegionSize=n | 设置 Region 大小,并非最终值 |
| -XX:MaxGCPauseMillis | 设置 G1 收集过程目标时间,默认值 200ms,不是硬性条件 |
| -XX:G1NewSizePercent | 新生代最小值,默认值 5% |
| -XX:G1MaxNewSizePercent | 新生代最大值,默认值 60% |
| -XX:ParallelGCThreads | STW 期间,并行 GC 线程数 |
| -XX:ConcGCThreads=n | 并发标记阶段,并行执行的线程数 |
| -XX:InitiatingHeapOccupancyPercent | 设置触发标记周期的 Java 堆占用率阈值。默认值是 45%。这里的 java 堆占比指的是 non_young_capacity_bytes,包括 old+humongous |
GC 日志
G1 收集器的日志与其他收集器有很大不同,源于 G1 独立的体系架构和数据结构,下面这两段日志来源于美团点评的 CRM 系统线上生产环境。
Young GC 日志
我们先来看看 Young GC 的日志:
{Heap before GC invocations=12 (full 1):
 garbage-first heap   total 3145728K, used 336645K [0x0000000700000000, 0x00000007c0000000, 0x00000007c0000000)
  region size 1024K, 172 young (176128K), 13 survivors (13312K)
 Metaspace       used 29944K, capacity 30196K, committed 30464K, reserved 1077248K
  class space    used 3391K, capacity 3480K, committed 3584K, reserved 1048576K
2014-11-14T17:57:23.654+0800: 27.884: [GC pause (G1 Evacuation Pause) (young)
Desired survivor size 11534336 bytes, new threshold 15 (max 15)
- age   1:    5011600 bytes,    5011600 total
 27.884: [G1Ergonomics (CSet Construction) start choosing CSet, _pending_cards: 1461, predicted base time: 35.25 ms, remaining time: 64.75 ms, target pause time: 100.00 ms]
 27.884: [G1Ergonomics (CSet Construction) add young regions to CSet, eden: 159 regions, survivors: 13 regions, predicted young region time: 44.09 ms]
 27.884: [G1Ergonomics (CSet Construction) finish choosing CSet, eden: 159 regions, survivors: 13 regions, old: 0 regions, predicted pause time: 79.34 ms, target pause time: 100.00 ms]
, 0.0158389 secs]
   [Parallel Time: 8.1 ms, GC Workers: 4]
      [GC Worker Start (ms): Min: 27884.5, Avg: 27884.5, Max: 27884.5, Diff: 0.1]
      [Ext Root Scanning (ms): Min: 0.4, Avg: 0.8, Max: 1.2, Diff: 0.8, Sum: 3.1]
      [Update RS (ms): Min: 0.0, Avg: 0.3, Max: 0.6, Diff: 0.6, Sum: 1.4]
         [Processed Buffers: Min: 0, Avg: 2.8, Max: 5, Diff: 5, Sum: 11]
      [Scan RS (ms): Min: 0.0, Avg: 0.1, Max: 0.1, Diff: 0.1, Sum: 0.3]
      [Code Root Scanning (ms): Min: 0.0, Avg: 0.1, Max: 0.2, Diff: 0.2, Sum: 0.6]
      [Object Copy (ms): Min: 4.9, Avg: 5.1, Max: 5.2, Diff: 0.3, Sum: 20.4]
      [Termination (ms): Min: 0.0, Avg: 0.0, Max: 0.0, Diff: 0.0, Sum: 0.0]
      [GC Worker Other (ms): Min: 0.0, Avg: 0.4, Max: 1.3, Diff: 1.3, Sum: 1.4]
      [GC Worker Total (ms): Min: 6.4, Avg: 6.8, Max: 7.8, Diff: 1.4, Sum: 27.2]
      [GC Worker End (ms): Min: 27891.0, Avg: 27891.3, Max: 27892.3, Diff: 1.3]
   [Code Root Fixup: 0.5 ms]
   [Code Root Migration: 1.3 ms]
   [Code Root Purge: 0.0 ms]
   [Clear CT: 0.2 ms]
   [Other: 5.8 ms]
      [Choose CSet: 0.0 ms]
      [Ref Proc: 5.0 ms]
      [Ref Enq: 0.1 ms]
      [Redirty Cards: 0.0 ms]
      [Free CSet: 0.2 ms]
   [Eden: 159.0M(159.0M)->0.0B(301.0M) Survivors: 13.0M->11.0M Heap: 328.8M(3072.0M)->167.3M(3072.0M)]
Heap after GC invocations=13 (full 1):
 garbage-first heap   total 3145728K, used 171269K [0x0000000700000000, 0x00000007c0000000, 0x00000007c0000000)
  region size 1024K, 11 young (11264K), 11 survivors (11264K)
 Metaspace       used 29944K, capacity 30196K, committed 30464K, reserved 1077248K
  class space    used 3391K, capacity 3480K, committed 3584K, reserved 1048576K
}
 [Times: user=0.05 sys=0.01, real=0.02 secs]
每个过程的作用如下:
- garbage-first heap total 3145728K, used 336645K [0x0000000700000000, 0x00000007c0000000, 0x00000007c0000000) 这行表示使用了 G1 垃圾收集器,total heap 3145728K,使用了 336645K。
- region size 1024K, 172 young (176128K), 13 survivors (13312K) Region 大小为 1M,青年代占用了 172 个(共 176128K),幸存区占用了 13 个(共 13312K)。
- Metaspace used 29944K, capacity 30196K, committed 30464K, reserved 1077248K class space used 3391K, capacity 3480K, committed 3584K, reserved 1048576K java 8 的新特性,去掉永久区,添加了元数据区,这块不是本文重点,不再赘述。需要注意的是,之所以有 committed 和 reserved,是因为没有设置 MetaspaceSize=MaxMetaspaceSize。
- [GC pause (G1 Evacuation Pause) (young) GC 原因,新生代 minor GC。
- [G1Ergonomics (CSet Construction) start choosing CSet, _pending_cards: 1461, predicted base time: 35.25 ms, remaining time: 64.75 ms, target pause time: 100.00 ms] 发生 minor GC 和 full GC 时,所有相关 region 都是要回收的。而发生并发 GC 时,会根据目标停顿时间动态选择部分垃圾对并多的 Region 回收,这一步就是选择 Region。_pending_cards 是关于 RSet 的 Card Table。predicted base time 是预测的扫描 card table 时间。
- [G1Ergonomics (CSet Construction) add young regions to CSet, eden: 159 regions, survivors: 13 regions, predicted young region time: 44.09 ms] 这一步是添加 Region 到 collection set,新生代一共 159 个 Region,13 个幸存区 Region,这也和之前的(172 young (176128K), 13 survivors (13312K))吻合。预计收集时间是 44.09 ms。
- [G1Ergonomics (CSet Construction) finish choosing CSet, eden: 159 regions, survivors: 13 regions, old: 0 regions, predicted pause time: 79.34 ms, target pause time: 100.00 ms] 这一步是对上面两步的总结。预计总收集时间 79.34ms。
- [Parallel Time: 8.1 ms, GC Workers: 4] 由于收集过程是多线程并行(并发)进行,这里是 4 个线程,总共耗时 8.1ms(wall clock time)
- [GC Worker Start (ms): Min: 27884.5, Avg: 27884.5, Max: 27884.5, Diff: 0.1] 收集线程开始的时间,使用的是相对时间,Min 是最早开始时间,Avg 是平均开始时间,Max 是最晚开始时间,Diff 是 Max-Min(此处的 0.1 貌似有问题)
- [Ext Root Scanning (ms): Min: 0.4, Avg: 0.8, Max: 1.2, Diff: 0.8, Sum: 3.1] 扫描 Roots 花费的时间,Sum 表示 total cpu time,下同。
- [Update RS (ms): Min: 0.0, Avg: 0.3, Max: 0.6, Diff: 0.6, Sum: 1.4] [Processed Buffers: Min: 0, Avg: 2.8, Max: 5, Diff: 5, Sum: 11] Update RS (ms) 是每个线程花费在更新 Remembered Set 上的时间。
- [Scan RS (ms): Min: 0.0, Avg: 0.1, Max: 0.1, Diff: 0.1, Sum: 0.3] 扫描 CS 中的 region 对应的 RSet,因为 RSet 是 points-into,所以这样实现避免了扫描 old generadion region,但是会产生 float garbage。
- [Code Root Scanning (ms): Min: 0.0, Avg: 0.1, Max: 0.2, Diff: 0.2, Sum: 0.6] 扫描 code root 耗时。code root 指的是经过 JIT 编译后的代码里,引用了 heap 中的对象。引用关系保存在 RSet 中。
- [Object Copy (ms): Min: 4.9, Avg: 5.1, Max: 5.2, Diff: 0.3, Sum: 20.4] 拷贝活的对象到新 region 的耗时。
- [Termination (ms): Min: 0.0, Avg: 0.0, Max: 0.0, Diff: 0.0, Sum: 0.0] 线程结束,在结束前,它会检查其他线程是否还有未扫描完的引用,如果有,则“偷”过来,完成后再申请结束,这个时间是线程之前互相同步所花费的时间。
- [GC Worker Other (ms): Min: 0.0, Avg: 0.4, Max: 1.3, Diff: 1.3, Sum: 1.4] 花费在其他工作上(未列出)的时间。
- [GC Worker Total (ms): Min: 6.4, Avg: 6.8, Max: 7.8, Diff: 1.4, Sum: 27.2] 每个线程花费的时间和。
- [GC Worker End (ms): Min: 27891.0, Avg: 27891.3, Max: 27892.3, Diff: 1.3] 每个线程结束的时间。
- [Code Root Fixup: 0.5 ms] 用来将 code root 修正到正确的 evacuate 之后的对象位置所花费的时间。
- [Code Root Migration: 1.3 ms] 更新 code root 引用的耗时,code root 中的引用因为对象的 evacuation 而需要更新。
- [Code Root Purge: 0.0 ms] 清除 code root 的耗时,code root 中的引用已经失效,不再指向 Region 中的对象,所以需要被清除。
- [Clear CT: 0.2 ms] 清除 card table 的耗时。
- [Other: 5.8 ms] [Choose CSet: 0.0 ms] [Ref Proc: 5.0 ms] [Ref Enq: 0.1 ms] [Redirty Cards: 0.0 ms] [Free CSet: 0.2 ms] 其他事项共耗时 5.8ms,其他事项包括选择 CSet,处理已用对象,引用入 ReferenceQueues,释放 CSet 中的 region 到 free list。
- [Eden: 159.0M(159.0M)->0.0B(301.0M) Survivors: 13.0M->11.0M Heap: 328.8M(3072.0M)->167.3M(3072.0M)] 新生代清空了,下次扩容到 301MB。
global concurrent marking 日志
对于 global concurrent marking 过程,它的日志如下所示:
66955.252: [G1Ergonomics (Concurrent Cycles) request concurrent cycle initiation, reason: occupancy higher than threshold, occupancy: 1449132032 bytes, allocation request: 579608 bytes, threshold: 1449
551430 bytes (45.00 %), source: concurrent humongous allocation]
2014-12-10T11:13:09.532+0800: 66955.252: Application time: 2.5750418 seconds
 66955.259: [G1Ergonomics (Concurrent Cycles) request concurrent cycle initiation, reason: requested by GC cause, GC cause: G1 Humongous Allocation]
{Heap before GC invocations=1874 (full 4):
 garbage-first heap   total 3145728K, used 1281786K [0x0000000700000000, 0x00000007c0000000, 0x00000007c0000000)
  region size 1024K, 171 young (175104K), 27 survivors (27648K)
 Metaspace       used 116681K, capacity 137645K, committed 137984K, reserved 1171456K
  class space    used 13082K, capacity 16290K, committed 16384K, reserved 1048576K
 66955.259: [G1Ergonomics (Concurrent Cycles) initiate concurrent cycle, reason: concurrent cycle initiation requested]
2014-12-10T11:13:09.539+0800: 66955.259: [GC pause (G1 Humongous Allocation) (young) (initial-mark)
…….
2014-12-10T11:13:09.597+0800: 66955.317: [GC concurrent-root-region-scan-start]
2014-12-10T11:13:09.597+0800: 66955.318: Total time for which application threads were stopped: 0.0655753 seconds
2014-12-10T11:13:09.610+0800: 66955.330: Application time: 0.0127071 seconds
2014-12-10T11:13:09.614+0800: 66955.335: Total time for which application threads were stopped: 0.0043882 seconds
2014-12-10T11:13:09.625+0800: 66955.346: [GC concurrent-root-region-scan-end, 0.0281351 secs]
2014-12-10T11:13:09.625+0800: 66955.346: [GC concurrent-mark-start]
2014-12-10T11:13:09.645+0800: 66955.365: Application time: 0.0306801 seconds
2014-12-10T11:13:09.651+0800: 66955.371: Total time for which application threads were stopped: 0.0061326 seconds
2014-12-10T11:13:10.212+0800: 66955.933: [GC concurrent-mark-end, 0.5871129 secs]
2014-12-10T11:13:10.212+0800: 66955.933: Application time: 0.5613792 seconds
2014-12-10T11:13:10.215+0800: 66955.935: [GC remark 66955.936: [GC ref-proc, 0.0235275 secs], 0.0320865 secs]
 [Times: user=0.05 sys=0.00, real=0.03 secs]
2014-12-10T11:13:10.247+0800: 66955.968: Total time for which application threads were stopped: 0.0350098 seconds
2014-12-10T11:13:10.248+0800: 66955.968: Application time: 0.0001691 seconds
2014-12-10T11:13:10.250+0800: 66955.970: [GC cleanup 1178M->632M(3072M), 0.0060632 secs]
 [Times: user=0.02 sys=0.00, real=0.01 secs]
2014-12-10T11:13:10.256+0800: 66955.977: Total time for which application threads were stopped: 0.0088462 seconds
2014-12-10T11:13:10.257+0800: 66955.977: [GC concurrent-cleanup-start]
2014-12-10T11:13:10.259+0800: 66955.979: [GC concurrent-cleanup-end, 0.0024743 secs
这次发生 global concurrent marking 的原因是:humongous allocation,上面提过在巨大对象分配之前,会检测到 old generation 使用占比是否超过了 initiating heap occupancy percent(45%),因为 1449132032(used)+ 579608(allocation request:) > 1449551430(threshold),所以触发了本次 global concurrent marking。对于具体执行过程,上面的表格已经详细讲解了。值得注意的是上文中所说的 initial mark 往往伴随着一次 YGC,在日志中也有体现:GC pause (G1 Humongous Allocation) (young) (initial-mark)。
后记
因为篇幅的关系,也受限于能力水平,本文只是简单了介绍了 G1 GC 的基本原理,很多细节没有涉及到,所以说只能算是为研究和使用它的同学打开了一扇门。一个日本人专门写了一本书《彻底解剖「G1GC」 アルゴリズ》详细的介绍了 G1 GC,这本书也被作者放到了 GitHub 上,详见参考文献 5。另外,莫枢在这方面也研究的比较多,读者可以去 高级语言虚拟机论坛 向他请教,本文的很多内容也是我在此论坛上请教过后整理的。总而言之,G1 是一款非常优秀的垃圾收集器,尽管还有些不完美(预测模型还不够智能),但是希望有更多的同学来使用它,研究它,提出好的建议,让它变的更加完善。